Thursday, July 7, 2016

Oracle GoldenGate Architecture

Introduction: GoldenGate is the Logical Replication solution provided by Oracle that can be used to replicate data across heterogeneous databases.

Overview of the Golden Gate Architecture:

Oracle GoldenGate provides the following methods for replication across multiple heterogeneous databases
  1. Initial Load: This method of GoldenGate replication supports the static extraction of the data records from one database and the loading of those records to another database (s).
  2. Change Synchronization: This  method supports the continuous extraction and replication of transactional DML as well as DDL changes (applies to supported databases) across source and target databases to keep them consistent or in sync.
Apart from the above two methods of replication, GoldenGate also provide means to extract data from a source database and replicate them to external files (of user’s choice) outside the database.
Note: Initial Load (as the name suggests) is primarily used at the beginning of a replication setup (prior to setting up a Change Synchronization Replication Environment) to assure that the source and target databases are in sync prior to replication setup. Initial Load method can also be used on top of the change synchronization method to address any inconsistencies between source and target objects.


Following diagram depicts the complete architecture of a GoldenGate Replication Process
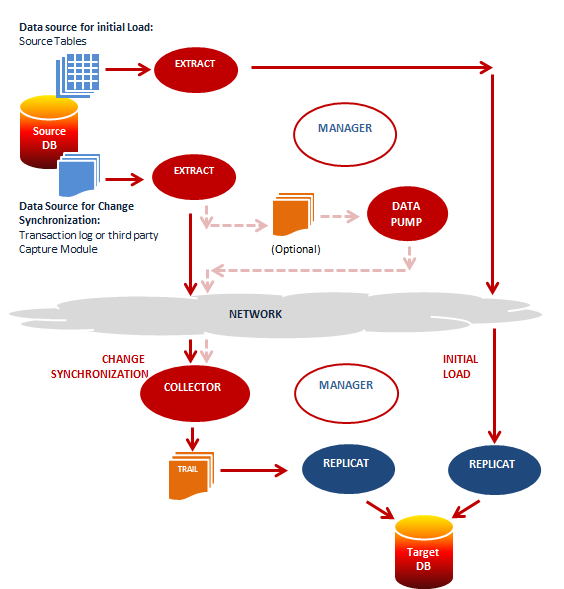
golden_gate_architecture

Oracle GoldenGate accomplishes the task of replication with the help of following integral components.
  • Extract
  • Data Pump
  • Collector
  • Replicat
  • Trails or Extract Files
  • Checkpoint (files and tables)
  • Manager

Brief about the GoldenGate Components:


Extract

This is a GoldenGate process (server process) on the source system and provides the functionality of capturing database changes from the source database.
Extract can be configured for any of  the following purposes:
  • Initial Load: For the Initial Load method of replication, extract captures a static set of data directly from the source table or objects.
  • Change Synchronization: In this method of replication, extract process continuously captures data (DML and DDL) from the source database to keep the source and target database in consistent state of replication and it is sole method to implement continuous replication between source and target database . Extract should be configured for the change synchronization following the initial load (To make sure source and target database are in sync prior to starting with the continuous replication).
The data source of the extract process could be one of the following
  • Source table (if the extract is configured for initial load)
  • The database transaction logs or recovery logs such as (Oracle Redo Logs, Oracle Archive Logs, or SQL audit trails or Sybase transaction logs) depending on the type of source database.
  • Third party capture module can also be used to extract transactional data from source database. In this method the data and metadata from and external API is passed to the extract API.
Extract captures changes from source database based on the extract configuration (contains the objects to be replicated from the source database). It is important to note that Extract captures only the committed transaction from its data source.
Multiple extract processes can be configured on a source database to operate on same/different source objects.
The extract performs either of the following tasks after extracting the data/records from the source database objects.
  • Delivers the the data extracted from source to the target server Trail Files through collector process
  • Writes the data extracted from source on to the Local Trail Files (would be discussed in coming sections) on source system

Optionally, Extract can also be configured to perform data filtering, transformation and mapping while capturing data and or before transferring the data to the target system.

DataPump

This is a optional GoldenGate process (server process) on the source system and comes into picture when the extracted data from source is not directly transferred to the target Trail Files. In the DataPump setup, the extract process gets the records/data from source and keeps it in local file system by means of local Trail Files. The DataPump acts as a secondary extract process where it reads the records from Local Trail Files and delivers to the Target system Trail files through collector.
Optionally, DataPump can also be configured to perform data filtering, transformation and mapping before transferring the data to the target system.

Collector

Collector is a server process that runs in the background on the target system in a GoldenGate replication setup where extract is configured for continuous Change Synchronization.
Collector has the following roles to perform in the GoldenGate replication.
  • When a connection request is sent from the source extract, the collector process on the target system scan and map the  requesting connection to available port and send the port details back to the manager for assignment to the requesting extract process.
  • Collector receives the data sent by source extract process and writes them to Trail Files on the target system.
There is one collector process on the target system per one extract process on the source system, i.e it is a one to one mapping between extract and collector process.

Replicat

The Replicat (note it is not replicate) process runs on the target system and is primarily responsible for replicating the extracted data delivered to the target trail files by the source extract process.
The replicat process scans the Trail Files on the target system, generates the DDL and DML from the Trail Files and finally applies them on to the target system.
Replicat has the following two types of configuration which relates to the type of extract being configured on the source system.
  • Initial loads: In initial data loads configuration, Replicat can apply a static data copy which is extracted by the Initial load extract to target objects or route it to a high-speed bulk-load utility.
  • Change synchronization: In change synchronization configuration, Replicat applies the continuous stream of data extracted from the source objects to the target objects using a native database interface or ODBC drivers, depending on the type of the target database.

Optionally, Replicat can also be configured to perform data filtering, transformation and mapping before applying the transaction on to the target database

Trail or Extract Files

 Trails or Extract Files are the Operating system files which GoldenGate use to keep records extracted from the source objects by the extract process. Trail files can be created on the source system and target system depending on the GoldenGate replication setup. Trail Files on the source system are called Extract Trails or Local Trails and on the target system called as Remote Trails.
By using trail GoldenGate minimize load on the source database as once the transaction logs/online logs/redo logs/ archive logs are extracted and loaded by the extract process to trail files, all the operations like filtering, conversions, mapping happens out of the source database. Use of trail file also make the extraction and replication process independent of each other.

Checkpoint

Checkpoint acts  as synchronization mechanism between source and target system in GoldenGate replication.  Checkpoint stores the current read and write position of a GoldenGate process to disks in order to ensure data consistency and integrity.
Following are the type of checkpoints maintained by GoldenGate
The extract process on the source system creates checkpoint for its read position in the data source (transaction logs) and  write position in the Local Trail files.
Extract Keeps a  current checkpoint which is the position in the transaction logs of the last record being read by extract (current read position from transaction log)  as well as a recovery checkpoint which is the position in the transaction log of the record containing the oldest transaction not yet processed by Extract. These checkpoints ensures that Extract is capturing the correct records from data source.
Extract also keeps a write checkpoint of  the Local trail. This checkpoint is the position in the trail where extract is currently writing the extracted records from data source. This checkpoint ensures that Extract is writing the correct records to the Trail Files.
The Replicat process on the target system keeps a checkpoint of the last read position of the Target Trail file i.e. checkpoint of the last record being replicated to the target database from the Remote Trail. This checkpoint ensures that correct record is replicated to the target database.
The checkpoints help in data synchronization, avoiding data redundancy as well as data recovery at the event of network or target failures.
The checkpoints are maintained by means of checkpoint files. However, in case of Replicat; checkpoints can also be maintained in user defined table on the target database.

Manager

Manager  can be considered as the parent process in a GoldenGate replication setup on both source and target system. Manger controls, manages and maintains  the functioning of other GoldenGate processes and files. A manager process is responsible for the following tasks.
  • Starting up Oracle GoldenGate processes
  • Maintaining port number for processes
  • Starting up dynamic processes
  • Performing GoldenGate Trail Management
  • Creating events, errors and threshold report.

setup DDL replication for GG


Configure Goldengate DDL replication between Oracle Databases

Environment Used for the excersie:

Source database : SRC
Target Database : TRGT

Listener Port : 1521

Source Schema : ggsender
Target Schema : ggreceiver

Source Manager Port : 7809
Target Manager Port : 7809

GG_HOME=/opt/oracle/gg/12.1.2 –> You may refer my earlier post for installation steps

ORACLE_HOME=/app/oracle/product/12.1.0

ORACLE Version : 12.1.0
GoldenGate Version : 12.1.2


Section A: Prepare Source and Target Database for replication

Step 1: Create Oracle Net services for source and target databases

Source TNS:
SRC =
(DESCRIPTION =
(ADDRESS = (PROTOCOL = TCP)(HOST = ggddltest.home.com)(PORT = 1521))
(CONNECT_DATA =
(SERVER = DEDICATED)
(SERVICE_NAME=SRC)
)
)


Target TNS:

TRGT =
(DESCRIPTION =
(ADDRESS = (PROTOCOL = TCP)(HOST = ggddltest.home.com)(PORT = 1521))
(CONNECT_DATA =
(SERVER = DEDICATED)
(SERVICE_NAME=SRC)
)
)

Verify TNS Ping
[oracle@ggddltest 12.1.2]$ tnsping SRC

TNS Ping Utility for Linux: Version 12.1.0.1.0 - Production on 09-AUG-2014 02:27:08

Copyright (c) 1997, 2013, Oracle. All rights reserved.

Used parameter files:
/app/oracle/product/12.1.0/network/admin/sqlnet.ora
Used TNSNAMES adapter to resolve the alias
Attempting to contact (DESCRIPTION = (ADDRESS = (PROTOCOL = TCP)(HOST = ggddltest.home.com)(PORT = 1521)) (CONNECT_DATA = (SERVER = DEDICATED) (SERVICE_NAME=SRC)))
OK (0 msec)


[oracle@ggddltest 12.1.2]$ tnsping TRGT

TNS Ping Utility for Linux: Version 12.1.0.1.0 - Production on 09-AUG-2014 02:27:11

Copyright (c) 1997, 2013, Oracle. All rights reserved.

Used parameter files:
/app/oracle/product/12.1.0/network/admin/sqlnet.ora
Used TNSNAMES adapter to resolve the alias
Attempting to contact (DESCRIPTION = (ADDRESS = (PROTOCOL = TCP)(HOST = ggddltest.home.com)(PORT = 1521)) (CONNECT_DATA = (SERVER = DEDICATED) (SERVICE_NAME=TRGT)))
OK (0 msec)


Step 2: Enable Database Force Logging in source database

SQL:SRC >select force_logging from v$database;

FORCE_LOGGING
---------------------------------------
NO

SQL:SRC >alter database force logging;

Database altered.

SQL:SRC >select force_logging from v$database;

FORCE_LOGGING
---------------------------------------
YES


Step 3: Enable supplemental logging in source database
SQL:SRC >select SUPPLEMENTAL_LOG_DATA_MIN from v$database;

SUPPLEME
--------
NO

SQL:SRC >alter database add supplemental log data;

Database altered.

SQL:SRC >select SUPPLEMENTAL_LOG_DATA_MIN from v$database;

SUPPLEME
--------
YES


Step 4: Create a GoldenGate user for source and target database

Source:
SQL:SRC >create tablespace gg_data datafile '+DATA' size 100m;

Tablespace created.

SQL:SRC >create user ggate identified by ggate default tablespace gg_data;

User created.

SQL:SRC >grant connect,resource, DBA to ggate;

Grant succeeded.

Target:
SQL:TRGT >create tablespace gg_data datafile '+DATA' size 100m;

Tablespace created.

SQL:TRGT >create user ggate identified by ggate default tablespace gg_data;

User created.

SQL:TRGT >grant connect,resource, DBA to ggate;

Grant succeeded.


Step 5: Execute necessary GoldenGate scripts to enable DDL replication in source and target database

Source:
[oracle@ggddltest ~]$ cd $GG_HOME
[oracle@ggddltest 12.1.2]$ pwd
/opt/oracle/gg/12.1.2
[oracle@ggddltest 12.1.2]$ sqlplus

SQL*Plus: Release 12.1.0.1.0 Production on Sat Aug 9 00:23:43 2014

Copyright (c) 1982, 2013, Oracle. All rights reserved.

Enter user-name: / as sysdba

Connected to:
Oracle Database 12c Enterprise Edition Release 12.1.0.1.0 - 64bit Production
With the Partitioning, Automatic Storage Management, OLAP, Advanced Analytics
and Real Application Testing options

SQL:SRC >@marker_setup.sql

-- Enter Oracle GoldenGate schema name:ggate

SQL:SRC >@ddl_setup.sql
-- Enter Oracle GoldenGate schema name:ggate

SQL:SRC >@role_setup.sql

-- Enter GoldenGate schema name:ggate

SQL:SRC >GRANT GGS_GGSUSER_ROLE TO ggate;

Grant succeeded.

SQL:SRC >@ddl_enable.sql

Trigger altered.


Target:
[oracle@ggddltest 12.1.2]$ cd $GG_HOME
[oracle@ggddltest 12.1.2]$ pwd
/opt/oracle/gg/12.1.2
[oracle@ggddltest 12.1.2]$ sqlplus

SQL*Plus: Release 12.1.0.1.0 Production on Sat Aug 9 00:26:40 2014

Copyright (c) 1982, 2013, Oracle. All rights reserved.

Enter user-name: / as sysdba

Connected to:
Oracle Database 12c Enterprise Edition Release 12.1.0.1.0 - 64bit Production
With the Partitioning, Automatic Storage Management, OLAP, Advanced Analytics
and Real Application Testing options

SQL:TRGT >@marker_setup.sql

-- Enter Oracle GoldenGate schema name:ggate

SQL:TRGT >@ddl_setup.sql

-- Enter Oracle GoldenGate schema name:ggate

SQL:TRGT >@role_setup.sql

-- Enter GoldenGate schema name:ggate

SQL:TRGT >GRANT GGS_GGSUSER_ROLE TO ggate;

Grant succeeded.

SQL:TRGT >@ddl_enable.sql

Trigger altered.


Step 6: Create the source and target database Schemas which are to be replicated

Source:
SQL:SRC >create user ggsender identified by ggsender;

User created.

SQL:SRC >grant connect,resource,unlimited tablespace to ggsender;

Grant succeeded.


Target:
SQL:TRGT >create user ggreceiver identified by ggreceiver;

User created.

SQL:TRGT >grant connect,resource,unlimited tablespace to ggreceiver;

Grant succeeded.


Step 7: Link the LD_LIBARY_PATH to point to GG_HOME and $ORACLE_HOME/lib
  
[oracle@ggddltest 12.1.2]$ export LD_LIBRARY_PATH=$ORACLE_HOME/lib:$GG_HOME
[oracle@ggddltest 12.1.2]$ echo $LD_LIBRARY_PATH
/app/oracle/product/12.1.0/lib:/opt/oracle/gg/12.1.2


Section B: Configure replication in GoldenGate

Step 1: Create and start GoldenGate Manager process
GGSCI (ggddltest.home.com) >edit params mgr
-- Port used for extract and replicate process communication ---

-- Manager process manages all the other GoldenGate processes ----

PORT 7809

GGSCI (ggddltest.home.com) >view params mgr

PORT 7809

GGSCI (ggddltest.home.com) > start mgr
Manager started.
GGSCI (ggddltest.home.com) > info manager

Manager is running (IP port ggddltest.home.com.7809, Process ID 7827).


Step 2: Add an extract (Capture) process for source database
GGSCI (ggddltest.home.com) >add extract xtct_s, tranlog, begin now
EXTRACT added.
GGSCI (ggddltest.home.com) >edit params xtct_s
-- Process group ---
extract xtct_s
--- Source database login info ----
userid ggate@SRC, password ggate
--- Required to support ASM ----
TRANLOGOPTIONS DBLOGREADER
--- Target Host and Manager Port for communication ----
rmthost ggddltest.home.com, mgrport 7809
--- Target Host trail files location ----------
rmttrail /opt/oracle/gg/12.1.2/dirdat/TRGT/rt
--- DDL Support --
ddl include mapped objname ggsender.*
--- Objects to be replicated ------
TABLE ggsender.*;


GGSCI (ggddltest.home.com) >view params xtct_s

extract xtct_s
userid ggate@SRC, password ggate
TRANLOGOPTIONS DBLOGREADER
rmthost ggddltest.home.com, mgrport 7809
rmttrail /opt/oracle/gg/12.1.2/dirdat/TRGT/rt
ddl include mapped objname ggsender.*
TABLE ggsender.*;
GGSCI (ggddltest.home.com) >add rmttrail /opt/oracle/gg/12.1.2/dirdat/TRGT/rt, extract xtct_s

RMTTRAIL added.


Step 3: Add Replicat (Delivery) Process for target database
GGSCI (ggddltest.home.com) >add replicat rpct_t, exttrail /opt/oracle/gg/12.1.2/dirdat/TRGT/rt, checkpointtable ggate.SRC_ckpt
REPLICAT added.
GGSCI (ggddltest.home.com) >dblogin userid ggate@TRGT, password ggate
Successfully logged into database.

GGSCI (ggddltest.home.com) >add checkpointtable ggate.SRC_ckpt

Successfully created checkpoint table ggate.SRC_ckpt.
GGSCI (ggddltest.home.com) >edit params rpct_t
-- Replicat process group ---
replicat rpct_t
-- Target database login info ---
userid ggate@TRGT, password ggate
-- Assuming same structure for source and target tables ---
assumetargetdefs
-- DDL Support ---
DDL
--- Mapping source and target schema for replication ---
MAP ggsender.*, TARGET ggreceiver.*;
GGSCI (ggddltest.home.com) >view params rpct_t

replicat rpct_t
userid ggate@TRGT, password ggate
assumetargetdefs
DDL
MAP ggsender.*, TARGET ggreceiver.*;


Step 4: Start Replication
GGSCI (ggddltest.home.com) >start extract XTCT_S

Sending START request to MANAGER ...
EXTRACT XTCT_S starting
GGSCI (ggddltest.home.com) >start replicat RPCT_T

Sending START request to MANAGER ...
REPLICAT RPCT_T starting
GGSCI (ggddltest.home.com) >info all

Program Status Group Lag at Chkpt Time Since Chkpt

MANAGER RUNNING
EXTRACT RUNNING XTCT_S 00:00:00 00:00:00
REPLICAT RUNNING RPCT_T 00:00:00 00:00:05


Step 5: Verify replication is working

Source:
SQL:SRC >conn ggsender/ggsender@SRC
Connected.
SQL:SRC >create table test_ggsender
 2 (
 3 id number(3),
 4 name varchar(10)
 5 );

Table created.

SQL:SRC >insert into test_ggsender values (100,'abc');

1 row created.

SQL:SRC >commit ;

SQL:SRC >conn ggreceiver/ggreceiver@TRGT
Connected.


Target
SQL:TRGT >select table_name from user_tables;

TABLE_NAME
--------------------------------------------------------------------------------
TEST_ggsender

SQL:TRGT >select * from TEST_ggsender;

ID          NAME
---------- ----------
100         abc


ORACLE REFERENCE : https://blogs.oracle.com/imc/entry/oracle_goldengate_configuring_ddl_replicationhttps://blogs.oracle.com/imc/entry/oracle_goldengate_configuring_ddl_replication

Other reference : https://blogs.oracle.com/imc/entry/oracle_goldengate_configuring_ddl_replication


REMOVE and RECREATE AWR repository from database


Recreate AWR in Oracle 11g
1: Check and make a note of the following parameter values
   
SQL> show parameter cluster_database
SQL> show parameter statistics_level
SQL> show parameter sga_target
SQL> show parameter memory_target
SQL> show parameter spfile


2: Disable AWR Snapshots by changing statistics level to ‘BASIC’


2.1: Backup the current parameter file (pfile/spfile) before modifying
--- if database is using spfile
---
SQL> create pfile='/backup/pfile_pre_awr_recreate.ora' from spfile;

--- if database is using pfile
---
SQL> create spfile='/backup/spfile_pre_awr_recreate.ora' from pfile;

--- if spfile is in diskgroup
---
SQL> create pfile='/backup/pfile_pre_awr_recreate.ora' from spfile='spfile_dg_path';


2.2: Set the following database parameters

If sga_target is not 0 (SGA tuning is enabled), then in pfile or spfile set the following memory parameters. This is to ensure that minimum required memory is available for each of the database memory  pools


alter system set shared_pool_size = 200m scope = spfile;
alter system set db_cache_size = 300m scope = spfile;
alter system set java_pool_size = 100 scope = spfile;
alter system set large_pool_size = 50 scope = spfile;

----- Reset the sga_target and memory_target parameters to avoid
----- ORA-00848: STATISTICS_LEVEL cannot be set to BASIC with SGA_TARGET or MEMORY_TARGET
-----
alter system reset sga_target scope= spfile;
alter system reset memory_target scope= spfile; 
alter system reset memory_max_target scope=spfile;


---- Set the statistics Level to Basic
----
alter system set statistics_level=basic scope=spfile;


-- Set the parameter cluster_database=false
-- applicable for RAC environment
--
alter system set cluster_database = false scope = spfile;


3: Shutdown and startup the database in RESTRICTED session. This is to make sure that no transactions occur against the database during the course of AWR recreation

--- In case of RAC, startup up only one instance
SQL> shut immediate

SQL> startup restrict;


4: Drop and Recreate the AWR Repository

---- make sure there are no objects from the following query after running catnoawr.sql
---- select table_name from dba_tables where table_name like 'WRM$_%' or table_name like 'WRH$_%';
---- If the query returns objects, drop them manually and then continue with recreation
----
SQL> start ?/rdbms/admin/catnoawr.sql

SQL> alter system flush shared pool;

SQL> start ?/rdbms/admin/catawrtb.sql

SQL> start ?/rdbms/admin/utlrp.sql

SQL> start ?/rdbms/admin/execsvrm.sql


5: Check for INVALID objects in the database and compile them manually
   
SQL> select owner,object_name,object_type from dba_objects where status<>’VALID’

SQL> alter object_type owner.object_name compile [body];


6: Restore the original parameter file (pfile/spfile) from the backup
   
SQL> create spfile from pfile='/backup/pfile_pre_awr_recreate.ora';


7: startup the database with the original parameter file (pfile/spfile)
--- In case of RAC, use srvctl to start all the database Instances
---
$srvctl start database -d [db_name];

or

SQL> startup


8:Take two AWR snapshots from the database

SQL> exec dbms_workload_repository.create_snapshot;

--- Wait for FIVE minutes and take another snapshot
---

SQL> exec dbms_workload_repository.create_snapshot;


9: Create a AWR report to validate the AWR functionality
SQL> start ?/rdbms/admin/awrrpt.sql

Scripts and process to check the fragmented table details. of the query and improve the performance


1.Check the execution time of the table.

set timer on;
select /*+ gather_plan_statistics */ count(*) from <Table_name> where <Conditions>;


2.Check the BLOCKread and Physical reads
   Generate explain plan and Check the execution plan also

set autotrace traceonly stat
select * from <table_name> where <Conditions>;

Statistics
----------------------------------------------------------
          1  recursive calls
          0  db block gets
     153854  consistent gets
     153847  physical reads
          0  redo size
        542  bytes sent via SQL*Net to client
        552  bytes received via SQL*Net from client
          2  SQL*Net roundtrips to/from client
          0  sorts (memory)
          0  sorts (disk)
          1  rows processed


3.Check the count(*) of the table.

select /*+ gather_plan_statistics */ count(*) from <Table_name> where <Conditions>;


4.check the size of the table.

select sum(bytes)/1024/1024 Size_MB from dba_segments where segment_name='<TABLE_NAME>';


5.Check the table fragmentation details.

---//
---// table fragmentation in Dev //---
---//
 select table_name,round((blocks*8/1024),2) "size (MB)" ,
  round((num_rows*avg_row_len/1024/1024),2) "actual_data (MB)",
  (round((blocks*8/1024),2) - round((num_rows*avg_row_len/1024/1024),2)) "wasted_space (MB)"
  from dba_tables
  where (round((blocks*8),2) > round((num_rows*avg_row_len/1024),2))
  and table_name = 'EVENT_DETAILS';

TABLE_NAME       size (MB) actual_data (MB) wasted_space (MB)
--------------- ---------- ---------------- -----------------
EVENT_DETAILS       1206.9          1001.36            205.54


6.Check the  High watermark.

---//
---// EVENT_DETAILS high water mark from Dev //---
---//
select t.table_name, s.blocks  "Block Allocated",
t.blocks "Block Used", (s.blocks-t.empty_blocks-1) "High Water Mark"
from user_tables t, user_segments s
where t.table_name=s.segment_name
and t.blocks <> (s.blocks-t.empty_blocks-1) and t.table_name ='EVENT_DETAILS';


TABLE_NAME      Block Allocated Block Used High Water Mark
--------------- --------------- ---------- ---------------
EVENT_DETAILS            155648     154483          155647


7.Do the table RE-ORG and STATS collection.

   
---//
---// reorganize fragmented table in QA //---
---//
SQL> alter table <table_name> move tablespace <tablespace_name>;

Table altered.


---//
---// gather table stats in QA //---
---//
SQL> exec dbms_stats.gather_table_stats('MYAPP','EVENT_DETAILS',degree=>2);

PL/SQL procedure successfully completed.


8.Check the TABLE FRAGMENTATION deatils and HIGH watermark details again.

9.Check the excution time

10.Check the physical and block reads again.


If still the performance problem exist, Create index on the condition columns.

check the EXECUTIOn PLAN and EXECUTION time and PHYSICAL READS and BLOCK READS


TO improve the Query performance when the script is going for FTS(full Table Scan) on a fragmented table? with Prctical


TO improve the Query performance when the script is going for FTS(full Table Scan) on a fragmented table?


Recently one of my application users complaint about a performance issue. They had a query that they were running in two different environments (Dev and QA) of the same application. The problem was that the query was taking less time where it had more number of rows to fetch and surprisingly taking more time where it had less number of rows to fetch.

To give you an idea, following are the execution plans from both of these environments.


---//
---// execution plan from Dev environment //---
---//
Plan hash value: 3586353056

-------------------------------------------------------------------------------------------------------
| Id  | Operation          | Name          | Starts | E-Rows | A-Rows |   A-Time   | Buffers | Reads  |
-------------------------------------------------------------------------------------------------------
|   0 | SELECT STATEMENT   |               |      1 |        |      1 |00:00:02.93 |     153K|    153K|
|   1 |  SORT AGGREGATE    |               |      1 |      1 |      1 |00:00:02.93 |     153K|    153K|
|*  2 |   TABLE ACCESS FULL| EVENT_DETAILS |      1 |   8000K|   8000K|00:00:03.25 |     153K|    153K|
-------------------------------------------------------------------------------------------------------

Predicate Information (identified by operation id):
---------------------------------------------------

   2 - filter("STATUS"='ACTIVE')


---//
---// execution plan from QA environment //---
---//
Plan hash value: 3586353056

-------------------------------------------------------------------------------------------------------
| Id  | Operation          | Name          | Starts | E-Rows | A-Rows |   A-Time   | Buffers | Reads  |
-------------------------------------------------------------------------------------------------------
|   0 | SELECT STATEMENT   |               |      1 |        |      1 |00:00:07.64 |     338K|    338K|
|   1 |  SORT AGGREGATE    |               |      1 |      1 |      1 |00:00:07.64 |     338K|    338K|
|*  2 |   TABLE ACCESS FULL| EVENT_DETAILS |      1 |   1999K|   1999K|00:00:07.14 |     338K|    338K|
-------------------------------------------------------------------------------------------------------

Predicate Information (identified by operation id):
---------------------------------------------------

   2 - filter("STATUS"='ACTIVE')

We have the same execution plan in both the environments. However, in Dev the query is completing in just 2.93 seconds processing 8 million rows. Whereas in QA the same query is taking 7.64 seconds processing less than quarter of rows (~ 2 million) when compared to Dev.

Here is the query, executed against the Dev and QA environments.


---//
---// query executed against Dev //---
---//
SQL> desc EVENT_DETAILS
 Name                                Null?    Type
 ----------------------------------- -------- ------------------------
 EVENT_ID                            NOT NULL NUMBER
 EVENT_MSG                           NOT NULL VARCHAR2(100)
 EVENT_TIME                          NOT NULL TIMESTAMP(6)
 STATUS                              NOT NULL VARCHAR2(10)

SQL> select /*+ gather_plan_statistics */ count(*) from EVENT_DETAILS where status='ACTIVE';

  COUNT(*)
----------
   8000000

Elapsed: 00:00:02.96

---//
---// Query executed against QA //---
---//
SQL> desc EVENT_DETAILS
 Name                                Null?    Type
 ----------------------------------- -------- ------------------------
 EVENT_ID                            NOT NULL NUMBER
 EVENT_MSG                           NOT NULL VARCHAR2(100)
 EVENT_TIME                          NOT NULL TIMESTAMP(6)
 STATUS                              NOT NULL VARCHAR2(10)

SQL> select /*+ gather_plan_statistics */ count(*) from EVENT_DETAILS where status='ACTIVE';

  COUNT(*)
----------
   1999533

Elapsed: 00:00:07.67

As we have seen earlier, both the queries are using the same execution plan. Now, the question is why it is taking more time in QA where it has to process less rows (~2 million) when compared to Dev. To find that answer, we need to have a closer looks at the execution plans from both the environments. If we analyse the execution plans, we could see the query has performed 153K block reads in Dev while processing 8 million rows. Whereas, in QA the same query performed 338K block reads while processing only ~2 million rows.

This is a clear indication that Oracle had to scan through more blocks in QA while processing the ~2 million rows. We can also confirm this fact by setting query autotrace as shown below.


---//
---// execution statistics from Dev //---
---//
SQL> set autotrace traceonly stat
SQL> select count(*) from EVENT_DETAILS where status='ACTIVE';


Statistics
----------------------------------------------------------
          1  recursive calls
          0  db block gets
     153854  consistent gets
     153847  physical reads
          0  redo size
        542  bytes sent via SQL*Net to client
        552  bytes received via SQL*Net from client
          2  SQL*Net roundtrips to/from client
          0  sorts (memory)
          0  sorts (disk)
          1  rows processed


---//
---// execution statistics from QA //---
---//
SQL> set autotrace traceonly stat
SQL> select count(*) from EVENT_DETAILS where status='ACTIVE';


Statistics
----------------------------------------------------------
          1  recursive calls
          0  db block gets
     338948  consistent gets
     338941  physical reads
          0  redo size
        545  bytes sent via SQL*Net to client
        551  bytes received via SQL*Net from client
          2  SQL*Net roundtrips to/from client
          0  sorts (memory)
          0  sorts (disk)
          1  rows processed

As we can see, the query has performed more number of block (physical/logical) reads in QA when compared to Dev, even though it had processed less rows in QA. Let’s take a look at the size of the table which the query is accessing in both Dev and QA environments.


---//
---// record count and table size in Dev //---
---//
SQL> select count(*) from EVENT_DETAILS;

  COUNT(*)
----------
  10000000

SQL> select sum(bytes)/1024/1024 Size_MB from dba_segments where segment_name='EVENT_DETAILS';

   SIZE_MB
----------
      1216


---//
---// record count and table size in QA //---
---//
SQL> select count(*) from EVENT_DETAILS;

  COUNT(*)
----------
   4000000

SQL> select sum(bytes)/1024/1024 Size_MB from dba_segments where segment_name='EVENT_DETAILS';

   SIZE_MB
----------
      2688

Here the problem is!! In Dev the table is consuming ~ 1.2 GB of space for 10 million rows, whereas in QA it is consuming almost double of the space (~ 2.5 GB) for just 4 million rows. This is a clear case of fragmentation which has caused the table to grow in size by leaving free spaces in between the table segments.

Let’s check, how fragmented is the table in both of the environments. Query used from this OTN thread.


---//
---// table fragmentation in Dev //---
---//
SQL> select table_name,round((blocks*8/1024),2) "size (MB)" ,
  2  round((num_rows*avg_row_len/1024/1024),2) "actual_data (MB)",
  3  (round((blocks*8/1024),2) - round((num_rows*avg_row_len/1024/1024),2)) "wasted_space (MB)"
  4  from dba_tables
  5  where (round((blocks*8),2) > round((num_rows*avg_row_len/1024),2))
  6  and table_name = 'EVENT_DETAILS'
  7  ;

TABLE_NAME       size (MB) actual_data (MB) wasted_space (MB)
--------------- ---------- ---------------- -----------------
EVENT_DETAILS       1206.9          1001.36            205.54


---//
---// table fragmentation in QA //---
---//
SQL> select table_name,round((blocks*8/1024),2) "size (MB)" ,
  2  round((num_rows*avg_row_len/1024/1024),2) "actual_data (MB)",
  3  (round((blocks*8/1024),2) - round((num_rows*avg_row_len/1024/1024),2)) "wasted_space (MB)"
  4  from dba_tables
  5  where (round((blocks*8),2) > round((num_rows*avg_row_len/1024),2))
  6  and table_name = 'EVENT_DETAILS'
  7  ;

TABLE_NAME       size (MB) actual_data (MB) wasted_space (MB)
--------------- ---------- ---------------- -----------------
EVENT_DETAILS      2654.38           404.36           2250.02

As we can observe, the table EVENT_DETAILS is heavily fragmented in the QA environment and around 2 GB of free space is wasted there. Now, if we look back to our execution plan, we could see the query is doing a full table scan (FTS) against the EVENT_DETAILS table. As we know, in a full table scan Oracle has to scan trough all the block until it reaches the High Water Mark even though the most of the blocks are empty.

If we look into the high water mark, we could see the table EVENT_DETAILS in QA has much higher high water mark when compared to Dev as found below.


---//
---// EVENT_DETAILS high water mark from Dev //---
---//
SQL> select t.table_name, s.blocks  "Block Allocated",
  2  t.blocks "Block Used", (s.blocks-t.empty_blocks-1) "High Water Mark"
  3  from user_tables t, user_segments s
  4  where t.table_name=s.segment_name
  5  and t.blocks <> (s.blocks-t.empty_blocks-1) and t.table_name ='EVENT_DETAILS'
  6  ;

TABLE_NAME      Block Allocated Block Used High Water Mark
--------------- --------------- ---------- ---------------
EVENT_DETAILS            155648     154483          155647


---//
---// EVENT_DETAILS high water mark from QA //---
---//
SQL> select t.table_name, s.blocks  "Block Allocated",
  2  t.blocks "Block Used", (s.blocks-t.empty_blocks-1) "High Water Mark"
  3  from user_tables t, user_segments s
  4  where t.table_name=s.segment_name
  5  and t.blocks <> (s.blocks-t.empty_blocks-1) and t.table_name ='EVENT_DETAILS'
  6  ;

TABLE_NAME      Block Allocated Block Used High Water Mark
--------------- --------------- ---------- ---------------
EVENT_DETAILS            344064     339761          344063

Since the table is heavily fragmented, we could do reorganization of the table to address the fragmentation. The simplest way to do the reorganization is to use the ALTER TABLE MOVE command as shown below. However, we may opt for other options (ONLINE REDFINITION, export/import) depending on the requirement and resource availability.

Note: If we choose to do reorganization using the MOVE command, then we need to rebuild the indexes associated with the table once the move operation is completed (as those indexes would be marked as UNSUABLE)


---//
---// reorganize fragmented table in QA //---
---//
SQL> alter table EVENT_DETAILS move tablespace MYAPP_TS;

Table altered.

---//
---// gather table stats in QA //---
---//
SQL> exec dbms_stats.gather_table_stats('MYAPP','EVENT_DETAILS',degree=>2);

PL/SQL procedure successfully completed.


---//
---// recheck table fragmentation in QA //---
---//
SQL> select table_name,round((blocks*8/1024),2) "size (MB)" ,
  2  round((num_rows*avg_row_len/1024/1024),2) "actual_data (MB)",
  3  (round((blocks*8/1024),2) - round((num_rows*avg_row_len/1024/1024),2)) "wasted_space (MB)"
  4  from dba_tables
  5  where (round((blocks*8),2) > round((num_rows*avg_row_len/1024),2))
  6  and table_name = 'EVENT_DETAILS'
  7  ;

TABLE_NAME       size (MB) actual_data (MB) wasted_space (MB)
--------------- ---------- ---------------- -----------------
EVENT_DETAILS       487.24           404.36             82.88

---//
---// check high water mark after table reorganization //---
---//
SQL> select t.table_name, s.blocks  "Block Allocated",
  2  t.blocks "Block Used", (s.blocks-t.empty_blocks-1) "High Water Mark"
  3  from user_tables t, user_segments s
  4  where t.table_name=s.segment_name
  5  and t.blocks <> (s.blocks-t.empty_blocks-1) and t.table_name ='EVENT_DETAILS'
  6  ;

TABLE_NAME      Block Allocated Block Used High Water Mark
--------------- --------------- ---------- ---------------
EVENT_DETAILS             62464      62367           62463

Once we reorganized the table, the high water mark as well as the wasted space has come down drastically. This reorganization will cause the High Water Marker adjustment for the table and in turn will result in less block scan while performing a full table scan.

Let’s execute the query against the QA environment and see if we can notice any improvements in the query performance.


---//
---// execute query against QA //---
---//
SQL> select /*+ gather_plan_statistics */ count(*) from EVENT_DETAILS where status='ACTIVE';

  COUNT(*)
----------
   1999533

Elapsed: 00:00:00.19

Wow!! our query is now executing in less than 1 sec when compared to earlier execution which was taking 7.64 secs. We can see the query is still using the same execution plan. However, it is doing much less number of I/O when compared to earlier executions as found below.


---//
---// execution plan from QA //---
---//
SQL> select * from table(dbms_xplan.display_cursor(null,null,'allstats last'));

PLAN_TABLE_OUTPUT
-------------------------------------------------------------------------------------------------------
SQL_ID  1s7nh198rxpq4, child number 0
-------------------------------------
select /*+ gather_plan_statistics */ count(*) from EVENT_DETAILS where
status='ACTIVE'

Plan hash value: 3586353056

-------------------------------------------------------------------------------------------------------
| Id  | Operation          | Name          | Starts | E-Rows | A-Rows |   A-Time   | Buffers | Reads  |
-------------------------------------------------------------------------------------------------------
|   0 | SELECT STATEMENT   |               |      1 |        |      1 |00:00:00.19 |   62025 |  62020 |
|   1 |  SORT AGGREGATE    |               |      1 |      1 |      1 |00:00:00.19 |   62025 |  62020 |
|*  2 |   TABLE ACCESS FULL| EVENT_DETAILS |      1 |   1999K|   1999K|00:00:00.15 |   62025 |  62020 |
-------------------------------------------------------------------------------------------------------

Predicate Information (identified by operation id):
---------------------------------------------------

2 - filter("STATUS"='ACTIVE')


20 rows selected.


---//
---// execution statistics from QA //---
---//
SQL> set autotrace traceonly stat
SQL> select count(*) from EVENT_DETAILS where status='ACTIVE';


Statistics
----------------------------------------------------------
          5  recursive calls
          0  db block gets
      62028  consistent gets
      62020  physical reads
          0  redo size
        545  bytes sent via SQL*Net to client
        551  bytes received via SQL*Net from client
          2  SQL*Net roundtrips to/from client
          0  sorts (memory)
          0  sorts (disk)
          1  rows processed

Our query is now doing only 62K block reads when compared to 338K block reads in the earlier case. We have improved the query performance by addressing the table fragmentation as the query was doing a full table scan (FTS) against the table. The other suitable option would be to create an appropriate index on the predicate columns to avoid a full table scan. Having an index will ensure that the query performance is stable even if the table is highly fragmented as Oracle doesn’t need to scan through blocks until the High Water Mark as shown below.


---//
---// creating index on query predicate //---
---//
SQL> create index event_details_stat_idx on event_details (status);

Index created.

---//
---// executing the query //---
---//
SQL> select /*+ gather_plan_statistics */ count(*) from EVENT_DETAILS where status='ACTIVE';

  COUNT(*)
----------
   1999533

Elapsed: 00:00:00.25

---//
---// check the execution plan //---
---//
SQL> select * from table(dbms_xplan.display_cursor(null,null,'allstats last'));

PLAN_TABLE_OUTPUT
------------------------------------------------------------------------------------------------------------------
SQL_ID  1s7nh198rxpq4, child number 0
-------------------------------------
select /*+ gather_plan_statistics */ count(*) from EVENT_DETAILS where
status='ACTIVE'

Plan hash value: 931614286

-------------------------------------------------------------------------------------------------------------------
| Id  | Operation             | Name                   | Starts | E-Rows | A-Rows |   A-Time   | Buffers | Reads  |
-------------------------------------------------------------------------------------------------------------------
|   0 | SELECT STATEMENT      |                        |      1 |        |      1 |00:00:00.25 |   10647 |  10625 |
|   1 |  SORT AGGREGATE       |                        |      1 |      1 |      1 |00:00:00.25 |   10647 |  10625 |
|*  2 |   INDEX FAST FULL SCAN| EVENT_DETAILS_STAT_IDX |      1 |   1999K|   1999K|00:00:00.53 |   10647 |  10625 |
-------------------------------------------------------------------------------------------------------------------

Predicate Information (identified by operation id):
---------------------------------------------------

2 - filter("STATUS"='ACTIVE')


20 rows selected.

As we can observe, if we opt for index, the query execution improves even further as Oracle can directly access the table blocks through the index resulting into less I/O activity for the query.